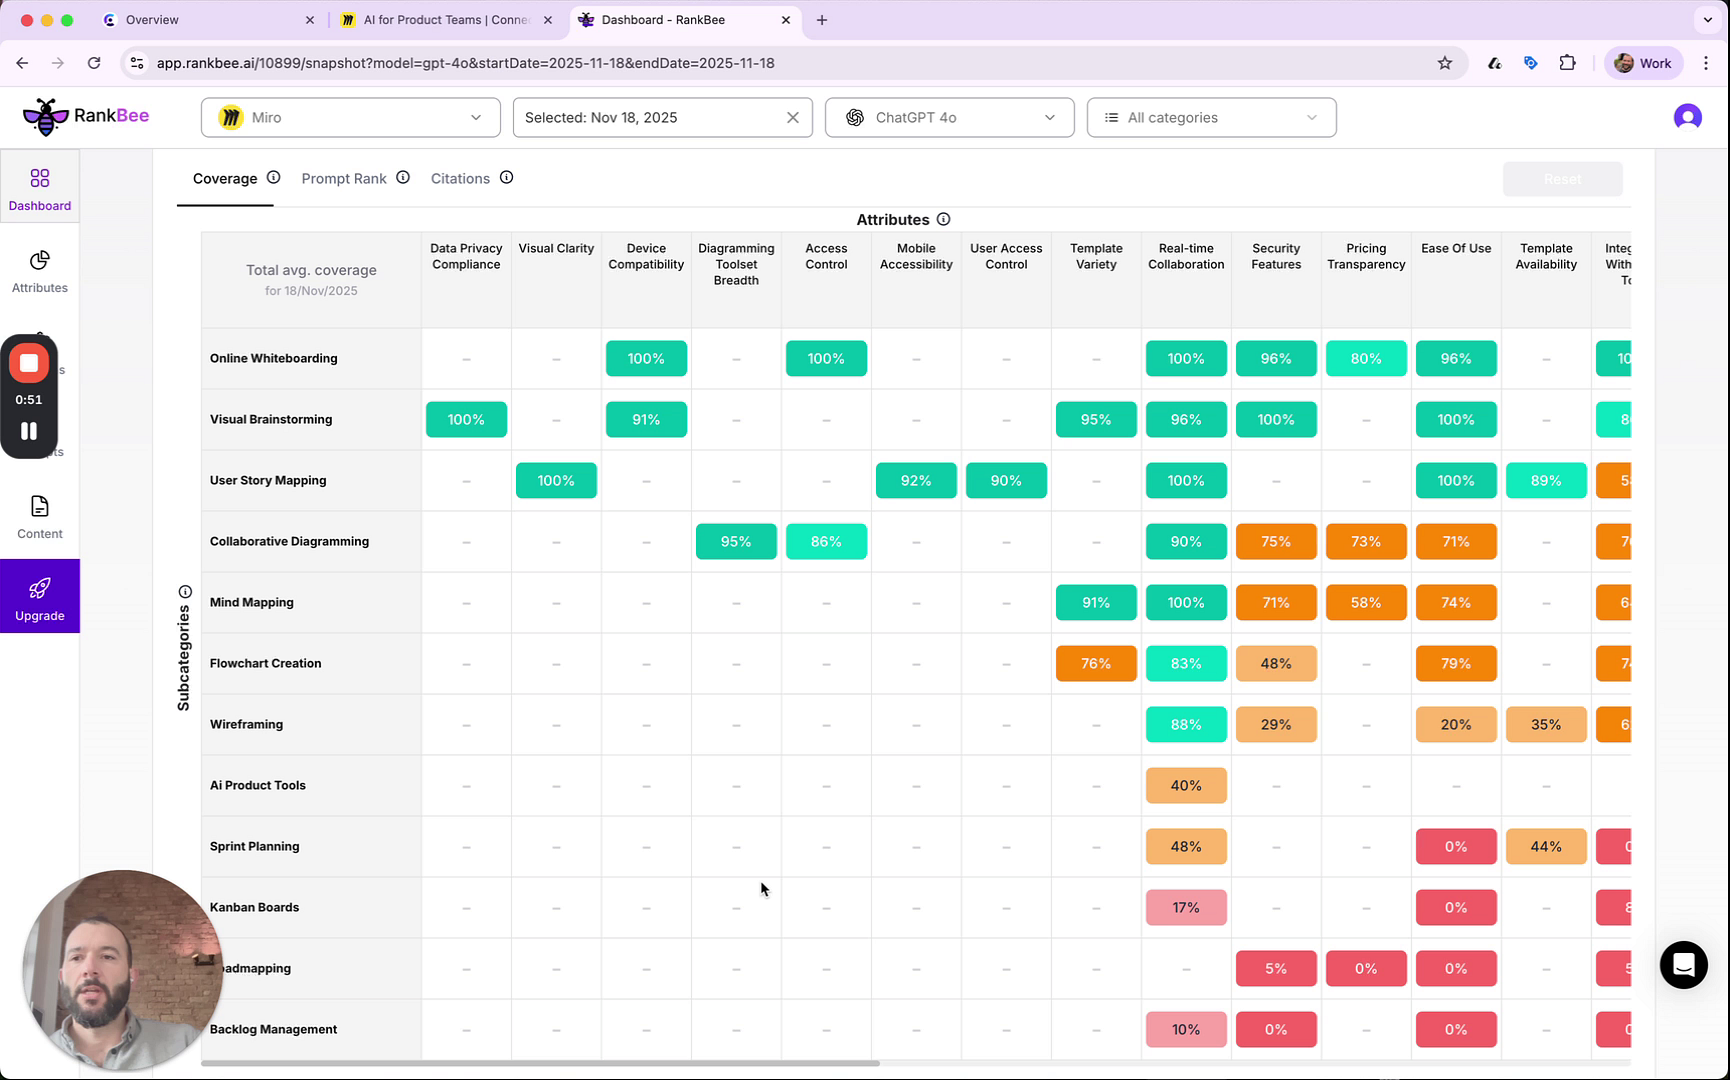
The Attributes Matrix provides a granular, feature-level breakdown of your brand's performance against key attributes within different product subcategories. Located on the main Dashboard below the Brand Performance chart, this matrix helps you pinpoint specific strengths and weaknesses in your content coverage.
Navigating the Attributes Matrix
The color-coding gives you an at-a-glance understanding of performance: green indicates strong coverage, orange is moderate, and red highlights gaps or weaknesses.
- Subcategories (Rows): The horizontal axis lists the different product categories or use cases where your brand competes, such as Online Whiteboarding, User Story Mapping, and Roadmapping.
- Attributes (Columns): Attributes are the specific features that define a product — such as Data Privacy Compliance, Mobile Accessibility, Ease of Use, and Real-time Collaboration — and in AI-driven search they act as core signals that help models understand what a product does and when it matches user intent. RankBee’s Attribute Benchmarking helps by automatically identifying which attributes matter most within each market segment, enabling data-driven recommendations to improve performance by adding or strengthening content around missing attributes or taking other targeted actions that increase visibility and relevance in AI search results.
- Performance Scores (Cells): Each cell contains a score that quantifies your performance for a specific attribute within a subcategory. The meaning of this score changes depending on the selected view.
Matrix Views
Above the matrix, you can toggle between three different views to analyze your performance from multiple perspectives:
- Coverage: This is the default view, showing your content coverage as a percentage. A high score means your content thoroughly addresses that specific attribute for the given subcategory.
- Prompt Rank: This view shows the average ranking your brand achieves in AI-generated responses when users ask about a particular attribute. A lower number indicates a better rank.
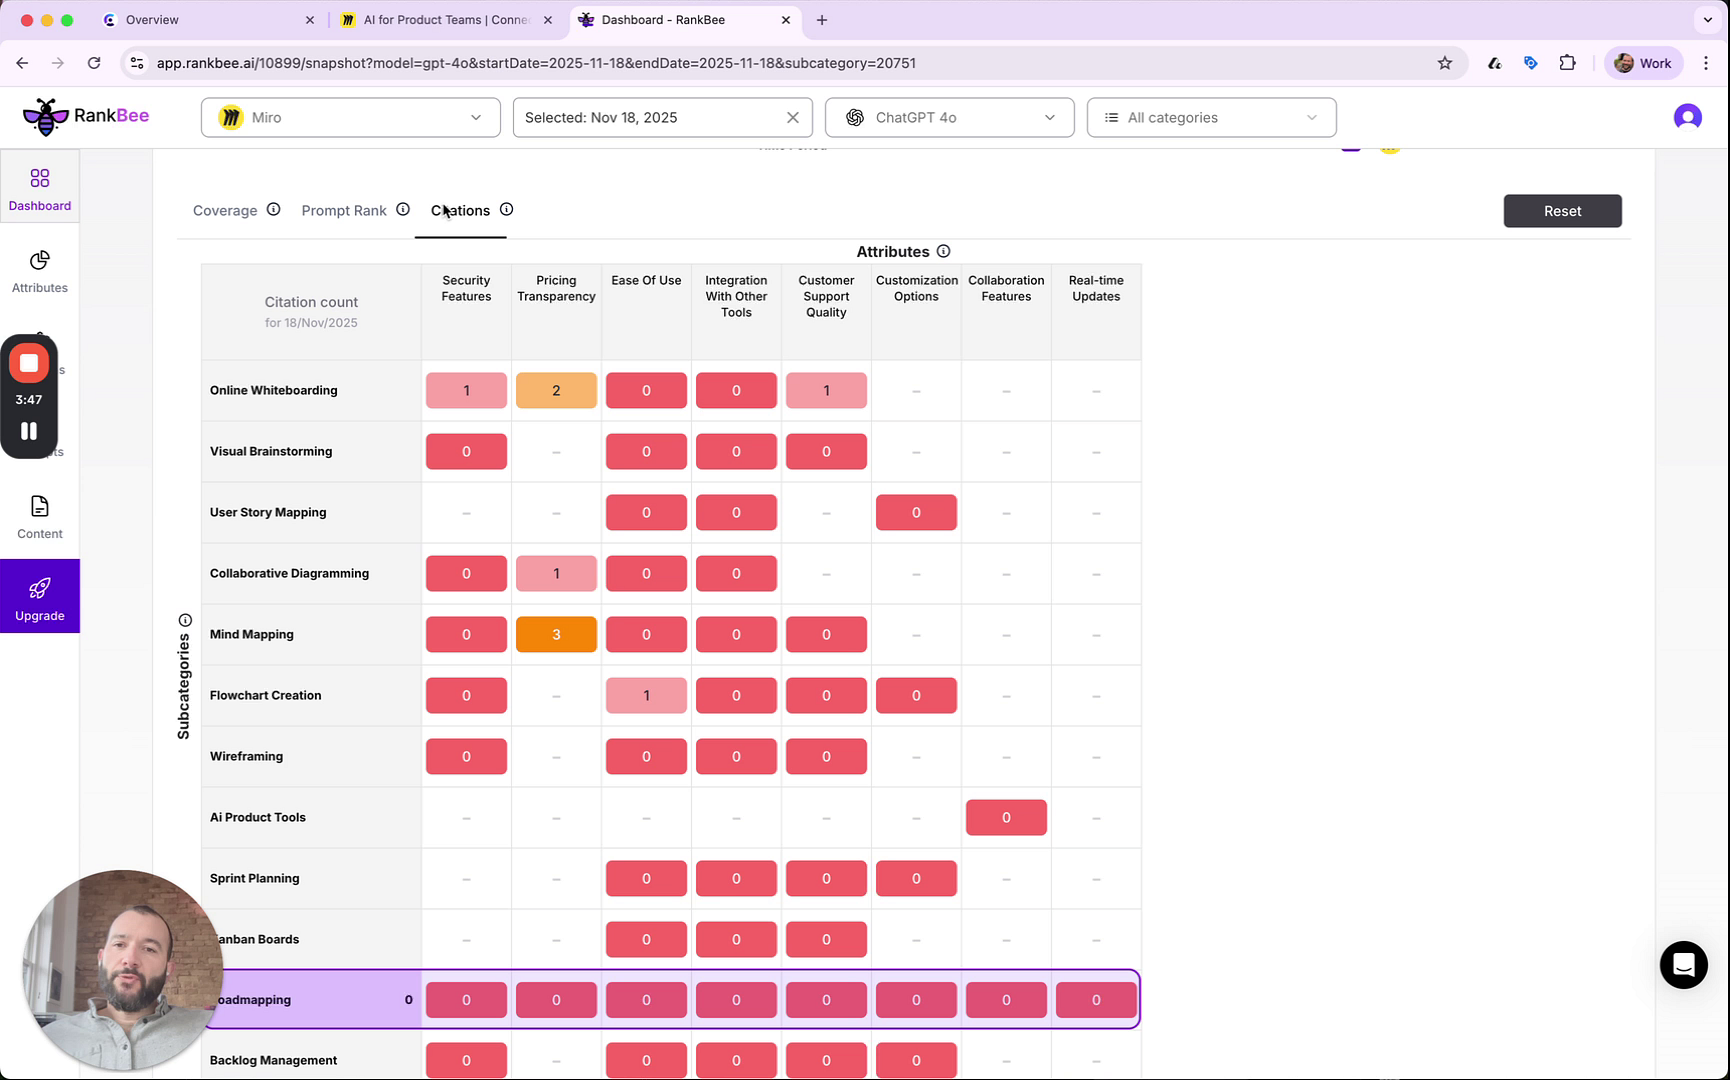
- Citations: This view displays the total number of times your brand has been cited or mentioned by AI in relation to a specific attribute. Higher numbers indicate greater authority and trust on your brand.
Tips for Using This Section
- Focus on the red and orange cells in the Coverage view to quickly identify low-hanging fruit for content creation and optimization.
- Compare your scores in weak subcategories (e.g., Roadmapping) with your scores in strong ones (e.g., Visual Brainstorming) to understand what attributes drive success.
- Use the data from the Attributes Matrix to inform the content you generate with the RankBee Writer, ensuring it directly addresses identified gaps.
Summary
This article explains the Attributes Matrix, a powerful tool on the Dashboard for analyzing your brand's feature-level performance. It details how to interpret the matrix's structure, including Subcategories, Attributes, and the different data views like Coverage, Prompt Rank, and Citations. By using this matrix, you can gain deep insights into specific content gaps and opportunities to improve your AI search visibility.